Evolution strategy. Unknown parameters estimation
In the class of evolutionary algorithms, there is a method called evolution strategy dating back to early 1960s. The core ideas of this technique are (1) candidates for solutions should only mutate in a mutation windows, and (2) we only take the best candidates from offspring combined with the parents population. In our case, we are given a measured signal coming from a known function with unknown parameters, and we need to determine their numerical value so that the imported data is well approximated by the given function. Thus, every solution candidate is a vector of estimated parameters and respective mutation steps.
Visit the project repository here!
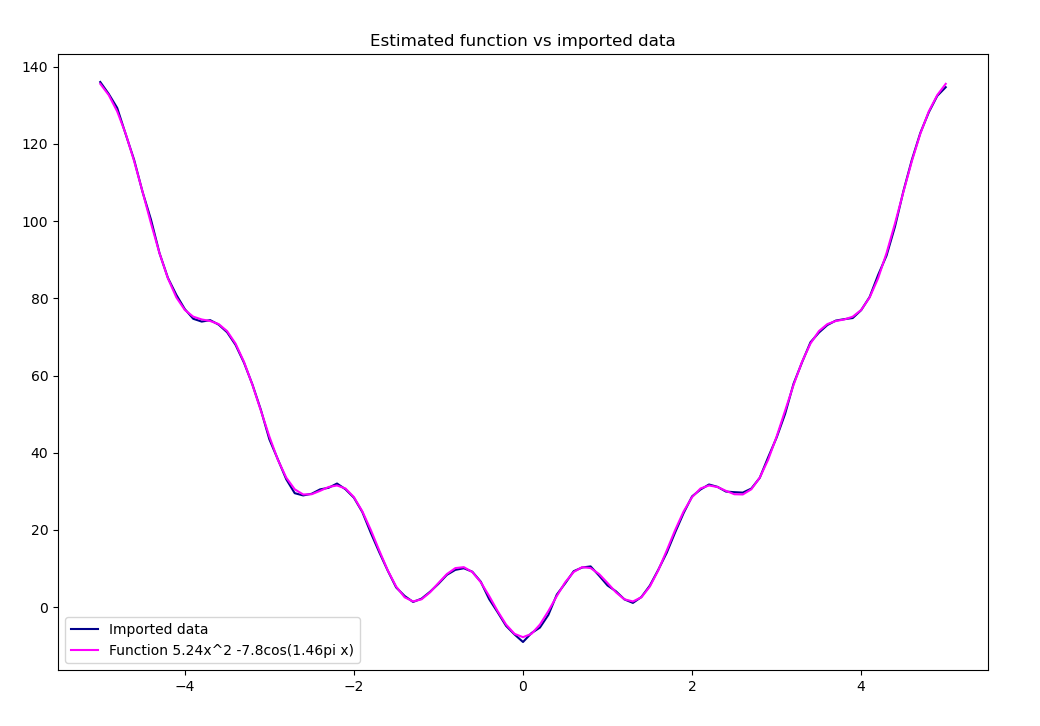
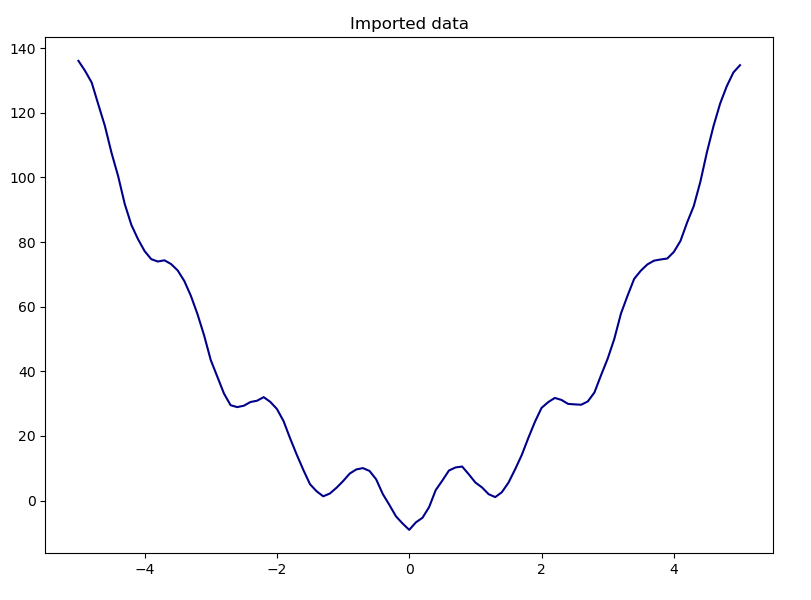
Given a function of form y(x) = ax² + bcos(cπx) and a set of (x, y) pairs, find the coefficients a, b and c, so that the function y closely approximates the input data within set error margin.
To create the population, we need a random set of candidates and mutation factors. The initial guesses are selected from a potentially good interval, i.e. normal distribution with σ = 5 bound between -10 and 10. While the wanted parameters evolve with the help of mutation factors, the mutation factors themselves are log-normal with coefficients τ1; and τ2.
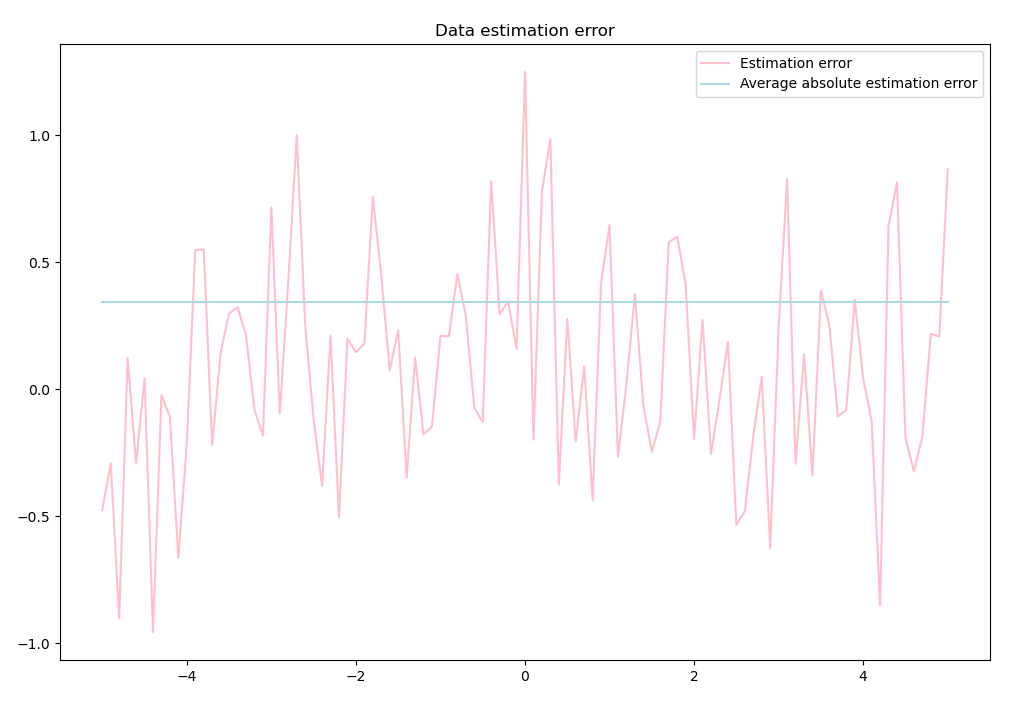
In every iteration of the algorithm an offspring population is generated from parents thorough mutation. The two groups are then combined and their fit to the input data is assessed. Only the best candidates are selected from this set and this is considered the parents population in the next iteration. The loop finishes when the difference between the best parent and the best offspring is smaller than given accuracy &eps;. Finally, the parameters are acquired from the best candidate in the final population and the resulting function is plotted against the input data. Additionally, the differences between the real and estimated values are shown on a graph.
            """Implementation of evolution strategy for gray box coefficient estimation."""
            import numpy as np
            import numpy.random as rnd
            import matplotlib.pyplot as plt


            def f(a, b, c, x):
                """Return the value of the function to be estimated (the gray box)."""
                return a*x**2 + b*np.cos(c*x*np.pi)


            def initial_x():
                """Return the vector of initial estimated coefficient."""
                a = min(max(rnd.randn()*5, -10), 10)
                b = min(max(rnd.randn()*5, -10), 10)
                c = min(max(rnd.randn()*5, -10), 10)
                return [a, b, c]


            def initial_sigma():
                """Return the vector of initial mutation factors."""
                s_a = rnd.randn()
                s_b = rnd.randn()
                s_c = rnd.randn()
                return [s_a, s_b, s_c]


            class Population:
                """Class for managing the evolving population."""

                def __init__(self, pop_size=100, mutations_count=5):
                    """Initialize a population and neccessary inner values."""
                    # The population holding vectors of solutions and their mutations
                    self.population = [initial_x() + initial_sigma()
                                       for i in range(pop_size)]
                    # The maximal size of the population
                    self.pop_size = pop_size
                    # The amount of offspring each parent has
                    self.mutations_count = mutations_count
                    # Mutations coefficients
                    self.tau_1 = 1/np.sqrt(2*pop_size)
                    self.tau_2 = 1/np.sqrt(2*np.sqrt(pop_size))

                def load_data(self, dataset_num):
                    """Load x and y data from the sspecified dataset."""
                    data = np.loadtxt('./data/ES_data_' + str(dataset_num) + '.dat')
                    self.data_x = [datapoint[0] for datapoint in data]
                    self.data_y = [datapoint[1] for datapoint in data]

                def mutate(self):
                    """Produce offspring for every vector in population."""
                    offspring = []
                    for mutation in range(self.mutations_count):
                        mutated = []
                        for i in range(self.pop_size):
                            # Calculate first mutation-changing coefficient
                            rnd_tau = rnd.randn() * self.tau_1
                            # Get a vector of target values and their mutations
                            v = np.array(self.population[i])
                            # Update target values using their mutations
                            a = v[0] + rnd.randn() * v[3]
                            b = v[1] + rnd.randn() * v[4]
                            c = v[2] + rnd.randn() * v[5]
                            # Update mutations using mutation coefficients
                            s_a = v[3] * np.exp(rnd_tau) * np.exp(rnd.randn()*self.tau_2)
                            s_b = v[4] * np.exp(rnd_tau) * np.exp(rnd.randn()*self.tau_2)
                            s_c = v[5] * np.exp(rnd_tau) * np.exp(rnd.randn()*self.tau_2)
                            # Add each newly created vector to the mutated population
                            mutated.append([a, b, c, s_a, s_b, s_c])
                        # Combine the mutated populations and return them as the offspring
                        offspring += mutated
                    return offspring

                def evaluate(self, group, best=False, indices=False):
                    """Return a dictionary of vector indices and theirs errors in order."""
                    # Create and populate the dictionary
                    error = {}
                    for i in range(len(group)):
                        v = np.array(group[i])
                        estimated_y = [f(v[0], v[1], v[2], x) for x in self.data_x]
                        error[i] = np.sum([(estimated_y[i] - self.data_y[i])**2
                                          for i in range(len(self.data_y))])
                    # Sort the dictionary by values
                    error = {index: error for (index, error) in sorted(error.items(),
                             key=lambda pair: pair[1])}
                    if best:
                        return list(error.values())[0]
                    if indices:
                        return list(error.keys())
                    return error

                def plot_results(self, a, b, c):
                    """Plot estimated and measured values."""
                    estimated_y = [f(a, b, c, x) for x in self.data_x]
                    errors = [estimated_y[i] - self.data_y[i]
                              for i in range(len(self.data_y))]

                    #  Plot the data and estimated function on one plot
                    plt.figure(figsize=(12, 8))
                    plt.plot(self.data_x, self.data_y, color='darkblue')
                    plt.plot(self.data_x, estimated_y, color='magenta')
                    if b < 0:
                        plt.legend(['Imported data', f'Function {round(a, 2)}x^2 '
                                    + f'{round(b, 2)}cos({round(c, 2)}pi x)'])
                    else:
                        plt.legend(['Imported data', f'Function {round(a, 2)}x^2 + '
                                    + f'{round(b, 2)}cos({round(c, 2)}pi x)'])
                    plt.title('Estimated function vs imported data')
                    plt.show()

                    # Plot estimation errors
                    plt.figure(figsize=(12, 8))
                    plt.plot(self.data_x, errors, color='pink')
                    plt.plot(self.data_x, [np.mean(list(map(abs, errors)))
                                           for _ in self.data_x], color='lightblue')
                    plt.legend(['Estimation error', 'Average absolute estimation error'])
                    plt.title('Data estimation error')
                    plt.show()
        if __name__ == '__main__':
            # Initialize the population and load a specific dataset to approximate
            p = Population()
            p.load_data(19)
            iterations = 0
            # State wanted accuracy (difference between best parent and best offspring)
            eps = 1e-3
            while(True):
                # Perform mutation, combination and reduction to the original size
                offspring = p.mutate()
                best_parent = p.evaluate(p.population, best=True)
                best_offspring = p.evaluate(offspring, best=True)
                p.population = p.population + offspring
                p.population = [p.population[i] for i in p.evaluate(
                    p.population, indices=True)[:p.pop_size]]
                iterations += 1

                # This difference of best individuals marks our stop condition
                if abs(best_parent - best_offspring) < eps:
                    break
            print(f'Condition met in {iterations} iterations')

            # The best estimated coefficients
            a, b, c = p.population[0][:3]
            print(f'Estimated values:\na = {a}\nb = {b}\nc = {c}')

            # Present the results with a graph
            p.plot_results(a, b, c)